FinOps 101 for Databricks: Transparency First
FinOps for Databricks stalls when teams optimize before they can explain spend. Build transparency first: attribution, explainability, shared definitions.
Most teams jump to optimizing Databricks spend before they can explain what’s driving it. That’s where FinOps hits the ceiling.
The Moment That Exposes the Gap
It starts the same way every time. Someone asks: “The Databricks bill went up. Can you explain why?” You pull a billing export. You eyeball the top clusters. You open a Slack thread. Later, you have a theory. Maybe it was that ML pipeline, maybe a warehouse that didn’t scale down. Nobody’s usually confident enough to act on it.
This is a FinOps moment. The practice either works here or it doesn’t. And for most teams, it doesn’t — because teams can see spend totals but can’t answer what changed, why, and who owns it. That gap makes optimization slow, risky, and political.
FinOps, in Plain Terms
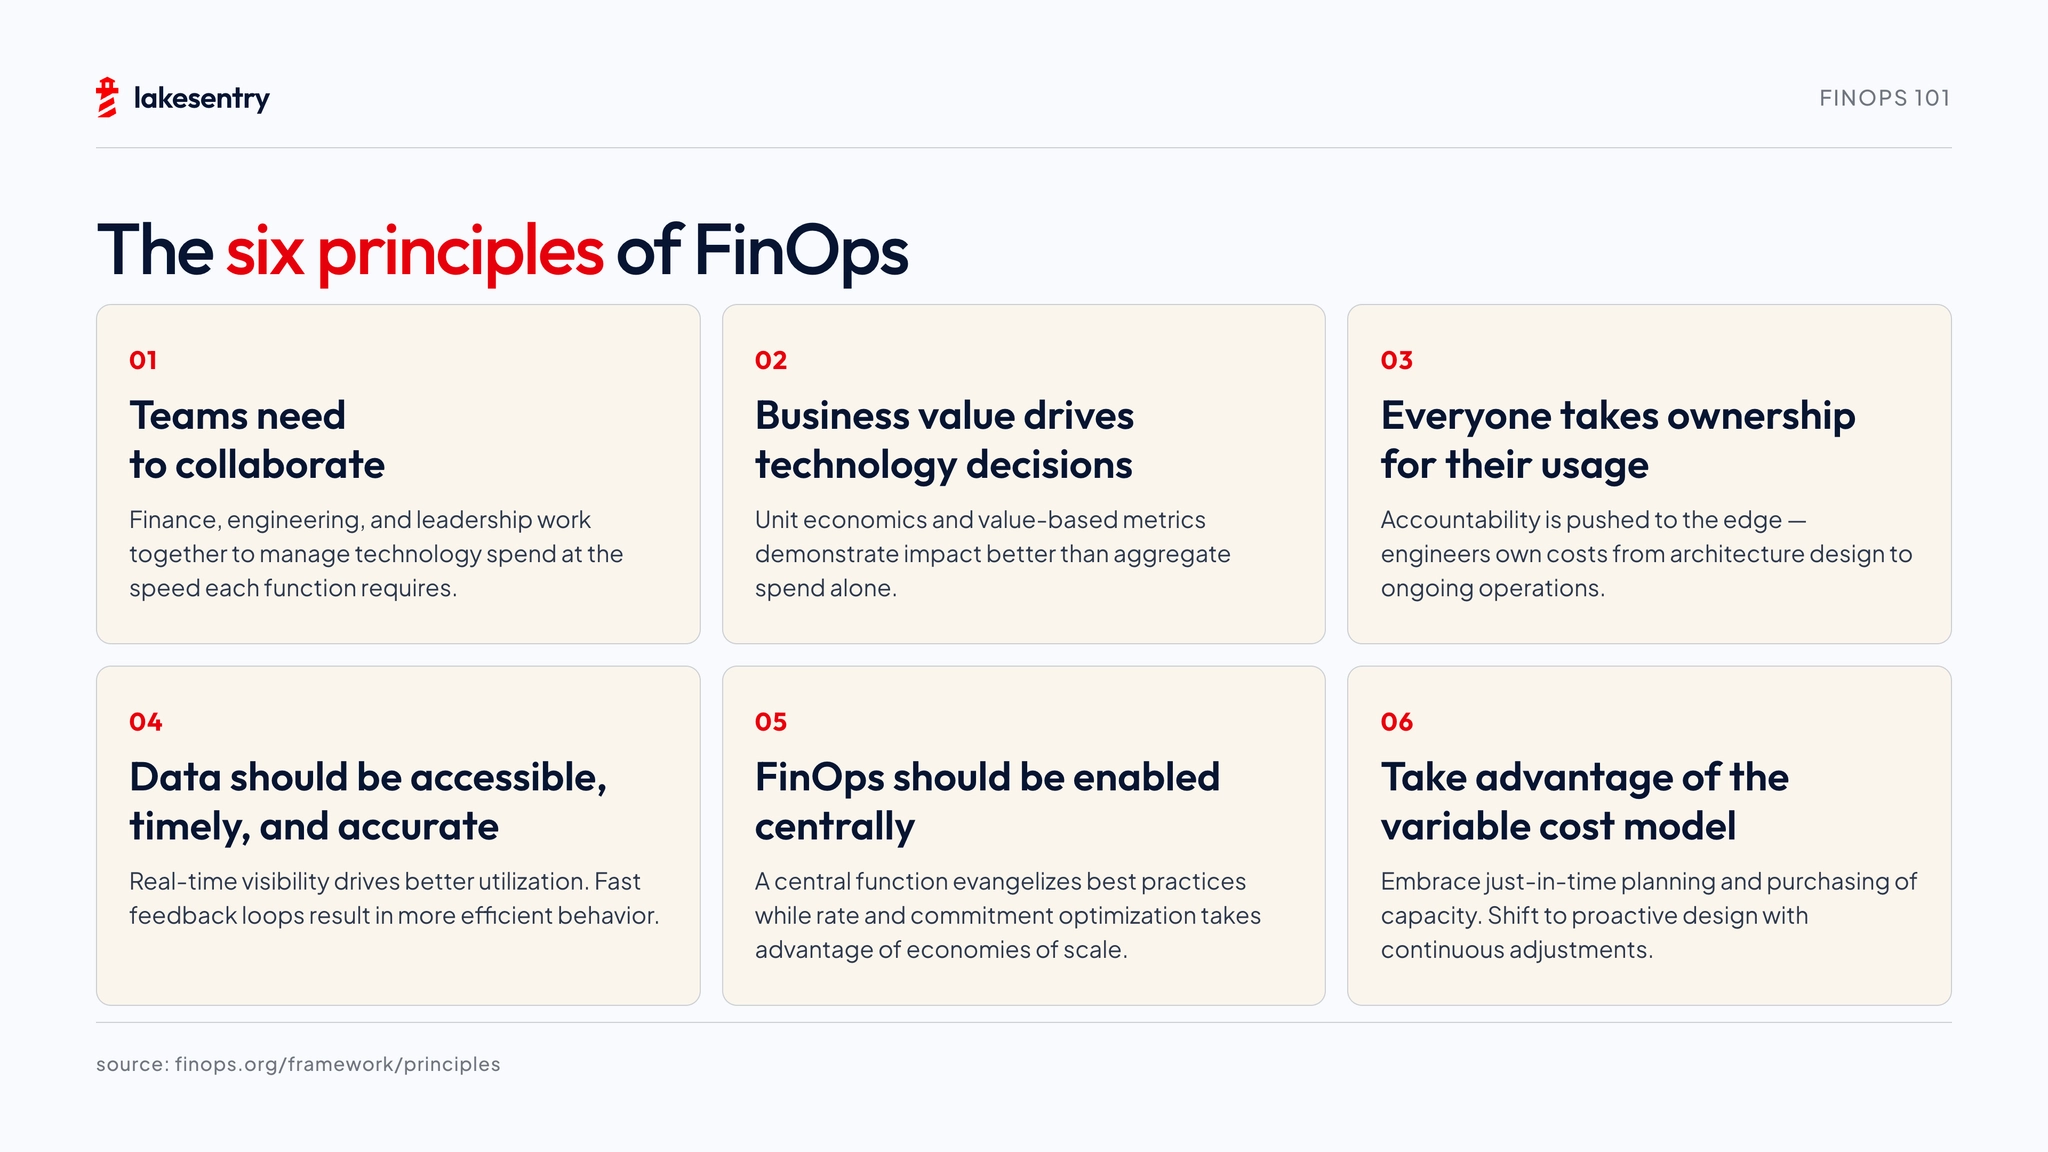
FinOps (cloud financial operations) is a discipline. It’s a collaboration model: engineering, finance, and platform teams making informed spend decisions together, on a regular cadence.
The framework has three pillars:
- Inform — visibility, allocation, shared definitions. Everyone sees the same numbers.
- Optimize — rate and usage adjustments. Rightsizing, commitments, workload tuning.
- Operate — governance and continuous improvement. The practice sustains itself.
The order is deliberate. Inform comes first. “63% of organizations have FinOps practices in place, but cost challenges persist” (Flexera 2026 State of the Cloud). Often because teams go straight to Optimize before Inform is working.
The Gap Between Adoption and Results
FinOps adoption is high and 85% rank cost management as their number one cloud priority, for the fourth consecutive year.
And yet, from the practitioner side: 42% currently prioritize workload optimization, but only 25% expect that to hold in the next twelve months. The reason, in their own words: “We have hit the ‘big rocks’ of waste and now face a high volume of smaller opportunities that require more effort to capture” (State of FinOps 2026).
Organizations have the practice. They don’t have the explainability to make it work at the next level.
Why Databricks Is Harder
FinOps practices like tagging, reserved capacity, and rightsizing are well-established for basic cloud infrastructure.
Tag your EC2 instances, buy reserved capacity, rightsize VMs. Databricks adds structural complexity that breaks that playbook.
The bill has two layers. DBUs are metered by Databricks. VMs, storage, and networking are billed separately by your cloud provider. A serverless migration can look like “DBUs up, infra down” while total cost barely moved. You have to separate the layers before you can diagnose anything.
Within the DBU layer, rates differ by workload type. All-Purpose Compute, Jobs Compute, SQL Warehouses, serverless: each has a different multiplier. The same pipeline on different compute produces a different invoice line. Then add shared clusters where nobody can name an owner, retry storms that compound cost without showing up cleanly, and SQL warehouses that scale up on Monday and never come back down.
For the full breakdown, see DBUs explained and why Databricks spend changes.
Transparency Before Optimization
Here is the core argument: optimization without transparency creates churn.
You cut something, can’t tell if it helped, cut something else, break a pipeline, roll back, lose credibility. When Databricks spend is explainable (by workload, owner, and weekly deltas), optimization becomes engineering work: routine and measurable.
Cost transparency has three components:
- Attribution: every cost line has a team, project, and environment attached.
- Explainability: you can say why something moved, not just that it moved.
- Shared definitions: workloads, environments, and ownership map to the bill the same way for everyone looking at it.
Optimization (cheaper compute types, autoscaling tuning, schedule adjustments) depends on all three. Without attribution you don’t know what to touch. Without explainability you can’t tell whether a change helped, or just moved the cost to a different line item.
Think of it like reliability. A single uptime number doesn’t help you fix an incident; you need signals broken down by service. Cost works the same way.
A Simple Maturity Ladder for Databricks
This is descriptive, not prescriptive. You don’t need Level 4 to be “good at FinOps.” But knowing where you are tells you what to build next.
- Level 0: Totals only. You see the monthly invoice. When spend moves, the investigation starts from scratch.
- Level 1: Allocation basics. You can answer “who owns this?” for most of the bill.
- Level 2: Explainability. You track week-over-week deltas by workload. When spend shifts, you can name the driver.
- Level 3: Operational loop. There’s a weekly review. Top movers get an owner and a disposition: expected, investigate, or act.
- Level 4: Continuous optimization. Changes happen inside the engineering workflow, measured against baselines.
Most of the pain sits between Level 0 and Level 2. That’s the transparency gap.
Why Transparency First: Three Practical Reasons
You answer faster when spend shifts. If data is attributed by workload and owner, the investigation starts from a shortlist.
You break less. If you don’t know why a workload runs on All-Purpose Compute, you don’t know what moving it will do downstream. Transparency tells you what you’re touching.
You argue less. “That’s not our spend” and “those clusters are necessary” are symptoms of missing attribution. Visible ownership and shared definitions take the argument out of the room.
Start Small This Week
Four moves to get from Level 0 toward Level 2:
- Pick one ownership unit. Team, project, or environment. Whichever your org already uses. No need to invent a new one.
- Build a top-drivers weekly view. Spend by workload, top 5–10 movers.
- Review deltas, not totals. A workload that costs the same every week isn’t interesting. One that doubled is, even if it’s small in absolute terms.
- Write down 2–3 guardrails before you optimize. What can’t break? Which SLAs are non-negotiable? This prevents the “we saved money but broke the pipeline” outcome.
If you want the “thermometer” view — what’s actually driving spend by workload and owner — LakeSentry has a free tier. No card. Connect a workspace and see what’s there.
It only reads Databricks system tables for usage and cost metadata. LakeSentry never accesses your business data, notebooks, or query results.
Comparing options? See the Databricks cost tools comparison.
See what's driving your Databricks spend — by workload and owner
Free tier — unlimited workspaces, no credit card. Connect in minutes.
Related reading
Databricks cost optimization is matching compute and warehouses to actual workload demand. Five steps: see cost, right-size, tune, automate, monitor.
How Databricks pricing works: what a DBU is, list rates by compute type, plan tiers, cloud and region differences, and the costs the calculator misses.
Native Databricks cost tools show totals from billing exports, system tables, and dashboards. They don't say what changed, who owns it, or what to do.
Evaluating Databricks cost tools? Compare them side by side →